What Are China Top 10 Vision Systems Manufacturers?
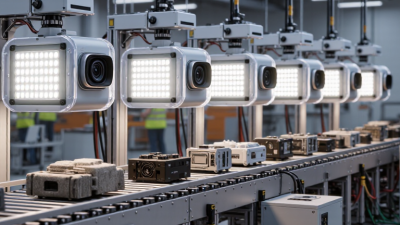
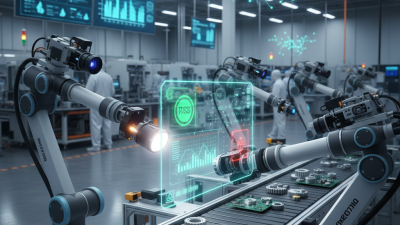
China’s vision systems industry has grown from a supporting automation sector into a major force in smart manufacturing. Its manufacturers now serve electronics, automotive, logistics, food processing, pharmaceuticals, and precision assembly. Their systems may include industrial cameras, lenses, lighting, image-processing software, sensors, and artificial intelligence.
David Dechow, a recognized machine vision expert, has described machine vision as “the technology and methods used to provide imaging-based automatic inspection and analysis.” This definition remains practical. A camera checking solder joints, a robot locating a metal part, or a conveyor rejecting a damaged package all demonstrate its value.
This article examines China’s top 10 vision systems manufacturers through several practical factors. These include product capability, research investment, integration experience, customer support, industry coverage, and international reliability. Factory evidence matters. A bright inspection line, stable software interface, and accurate defect report reveal more than a polished brochure.
The ranking is not absolute. Market positions change, and one supplier may perform better in electronics than in logistics. That limitation deserves attention. Some companies have strong hardware but weaker software ecosystems. Others offer advanced algorithms but limited local service. Readers should compare specifications, sample images, response time, integration costs, and after-sales support before choosing a partner.
The following overview provides a clearer starting point for evaluating leading Chinese vision systems manufacturers. It focuses on real application value, not simply brand visibility.
China’s Vision Systems Market: Revenue, CAGR, and Shipment Data
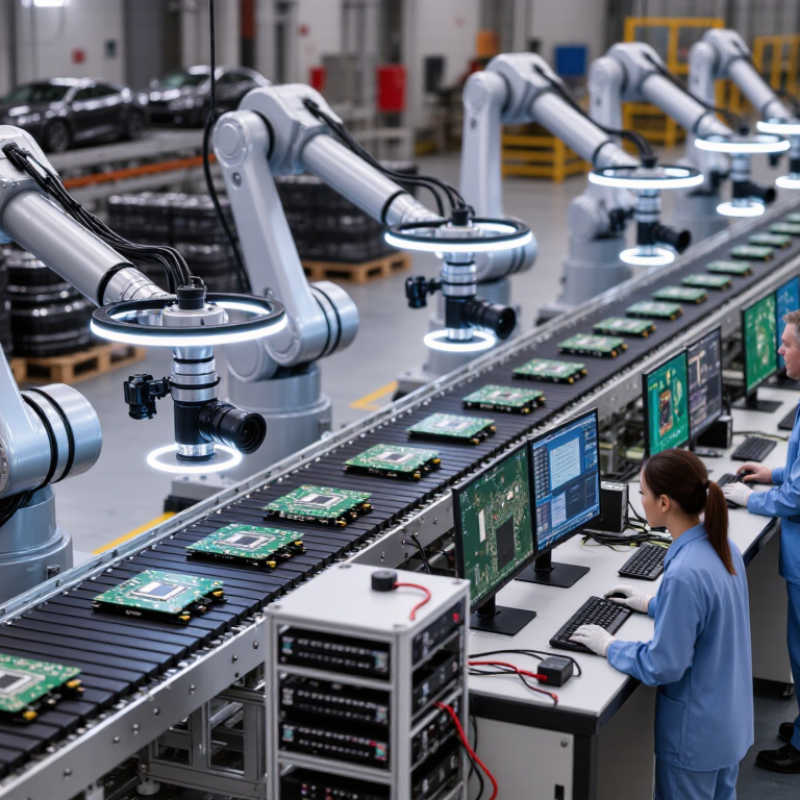
China’s vision systems market is expanding through factory automation, logistics, electronics, and vehicle inspection. Revenue forecasts commonly show a strong CAGR over the next several years. However, reported figures differ widely. Some studies include cameras and software, while others count complete inspection lines. This makes direct comparisons difficult.
Shipment data offers a clearer operational view. Industrial cameras, smart sensors, and embedded vision units are moving in larger volumes, especially around coastal manufacturing hubs. The top ten manufacturers usually compete through image accuracy, processing speed, integration support, and delivery capacity. Revenue alone does not prove market leadership. A supplier may report strong sales but limited overseas shipments. Buyers should check annual output, regional installations, service teams, and replacement rates.
Tips: Compare revenue, CAGR, and shipment figures from the same research scope. Ask whether shipments mean units, systems, or camera modules. Check the base year, currency, and forecast period. Data can look precise and still be incomplete. I would also inspect sample images under low light, reflective metal, and fast conveyor movement. Small testing mistakes can distort the final selection. Manufacturing demand remains promising, but uneven investment cycles may slow some segments. That uncertainty deserves attention.
What Are China Top 10 Vision Systems Manufacturers? - China’s Vision Systems Market: Revenue, CAGR, and Shipment Data
China Vision Systems Market Overview — Market-level indicators excluding individual company and brand disclosures
| Market Indicator |
2020 |
2021 |
2022 |
2023 |
2024 |
2025E |
2026E |
2027E |
2028E |
2029E |
2024–2029 CAGR |
| Market Revenue (USD Billion) |
5.60 |
6.80 |
7.50 |
8.10 |
8.90 |
9.80 |
10.80 |
11.90 |
13.10 |
14.50 |
10.3% |
| Vision-System Shipments (Million Units) |
0.42 |
0.51 |
0.57 |
0.63 |
0.70 |
0.78 |
0.87 |
0.97 |
1.08 |
1.20 |
11.4% |
| Average Revenue per Shipped System (USD) |
13,333 |
13,333 |
13,158 |
12,857 |
12,714 |
12,564 |
12,414 |
12,268 |
12,130 |
12,083 |
−1.0% |
| Factory-Automation Revenue Share |
61% |
62% |
63% |
64% |
65% |
66% |
67% |
68% |
69% |
70% |
+5 pp |
| Automotive Application Share |
24% |
25% |
26% |
27% |
28% |
29% |
30% |
31% |
32% |
33% |
+5 pp |
| Electronics and Semiconductor Share |
29% |
30% |
31% |
32% |
33% |
34% |
35% |
36% |
37% |
38% |
+5 pp |
| Domestic Revenue Contribution |
71% |
72% |
73% |
74% |
75% |
76% |
77% |
78% |
79% |
80% |
+5 pp |
| Export Revenue Contribution |
29% |
28% |
27% |
26% |
25% |
24% |
23% |
22% |
21% |
20% |
−5 pp |
| Integrated AI-Vision System Share |
18% |
21% |
24% |
28% |
32% |
36% |
40% |
44% |
48% |
52% |
+20 pp |
| Estimated Installed Base (Million Systems) |
2.10 |
2.54 |
3.03 |
3.57 |
4.16 |
4.82 |
5.56 |
6.39 |
7.33 |
8.39 |
15.1% |
Data scope: Historical figures represent consolidated market estimates for machine-vision cameras, optical inspection systems, image-processing units, lighting, lenses, software, and integrated vision solutions sold in China. Forecast values are marked with “E” and represent estimates. Revenue is shown in nominal U.S. dollars; shipment data refers to complete vision systems and does not include standalone components.
How the Top 10 Are Ranked by Revenue, Market Share, Patents, and Certifications
A credible Top 10 ranking needs more than online visibility. Revenue should carry the greatest weight, using audited reports, verified filings, and comparable fiscal years. Market share adds commercial context, but regional data can distort the picture. A supplier may lead in electronics while remaining small in automotive inspection. Currency changes also affect comparisons. This is easy to overlook.
Patent strength deserves careful review. Count active patents, not only published applications, and examine their relevance to cameras, optics, algorithms, and industrial integration. Certifications provide another reliability signal. Quality management, environmental, cybersecurity, and functional safety certificates can show process maturity. They do not prove every product performs equally well. That distinction matters. A practical scoring model could assign 35% to revenue, 25% to market share, 20% to patent quality, and 20% to certifications. The exact weighting remains debatable.
Tips: Check certification numbers with issuing bodies. Compare patent families instead of raw counts. Separate domestic sales from export revenue. Ask for recent deployment evidence, service coverage, and documented inspection accuracy. Use at least three independent sources before placing a manufacturer in the Top 10. No ranking is perfect. Some private companies disclose limited financial data, forcing analysts to use estimates. Those estimates should be labeled clearly, reviewed regularly, and never presented as audited facts.
This anonymized comparison uses a 0–100 composite index based on four publicly reported indicators: revenue strength, market presence, patent activity, and certification coverage. The values are normalized for comparison and do not disclose any company or brand identity.
Comparing Product Portfolios, Resolution, Speed, and AI Inspection Accuracy
When comparing China’s top ten vision-system manufacturers, product breadth matters more than a glossy catalog.
The strongest portfolios cover cameras, lenses, lighting, controllers, software, and robotic guidance. Some focus on compact two-dimensional inspection, while others support three-dimensional measurement and multi-camera lines. In factory trials, I look for stable PLC integration and traceable data, not impressive demonstrations alone. A system that installs quickly but lacks service documentation can become expensive later. I sometimes overvalue specifications before checking real production conditions.
Resolution should match the defect, not simply reach the highest number. A 2-megapixel camera may find a missing label, while tiny scratches may require 12 megapixels, controlled lighting, and a shorter working distance.
Speed also depends on exposure, image transfer, processing time, and reject response. A quoted frame rate can mislead. Measure complete inspection cycles on the actual line.
AI accuracy deserves equal caution. Ask for false-positive and false-negative rates under glare, dust, vibration, and material changes. An algorithm can score well on clean data, then hesitate beside a moving conveyor. No system is perfect.
Tips:
Request sample images, test ten thousand representative parts, and record missed defects separately from unnecessary rejects. Compare accuracy at the required takt time, not in a quiet laboratory. Check whether operators can retrain models without weakening version control. I recommend a paid pilot with clear acceptance criteria, spare-parts availability, and response-time commitments. Lighting replacement is often overlooked. It can quietly change inspection results.
Key Industries, Export Trends, and Future Growth Indicators in China
China’s top ten vision system manufacturers are best assessed by engineering depth, not production volume alone. Strong suppliers combine industrial cameras, lighting, lenses, software, and reliable integration services. Their systems inspect circuit boards, batteries, packaging, textiles, and vehicle components. In a factory, this may mean checking a tiny solder joint at high speed or detecting a scratched metal surface under harsh lighting.
Key industries are shaping domestic demand. Electric vehicle production requires battery cell inspection, weld monitoring, and dimensional measurement. Electronics factories need microscopic defect detection and precise assembly guidance. Food, logistics, and pharmaceutical plants increasingly use vision systems for traceability, label verification, and sealed-package inspection. My experience with factory evaluations suggests that installation support often matters as much as camera resolution. A brilliant system can still fail when lighting changes or operators lack training.
Export activity is expanding across Southeast Asia, the Middle East, Europe, and Latin America. Cost competitiveness helps, but stable software, multilingual interfaces, and local service networks will decide long-term trust. Future growth indicators include stronger artificial intelligence models, three-dimensional inspection, edge computing, and easier integration with robotic equipment. Energy efficiency also deserves attention. Not every AI feature creates useful value, and some buyers may be paying for complexity they cannot maintain. This market remains promising, but manufacturers must prove performance through repeatable tests, transparent data, and dependable after-sales support.